Forex Trading Tutorials
Japanese Candlesticks

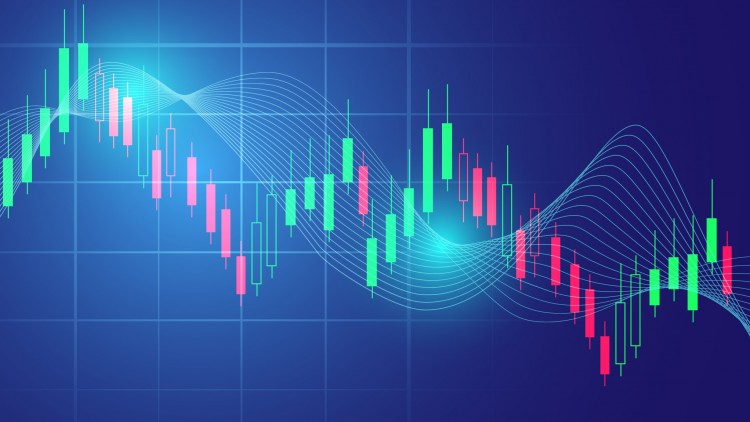
Chart is the most essential element for any technical analyst. There are various methods of plotting the charts. Candlestick charting is one of the most favored techniques for visual analysis. Candlestick charting was first developed by Japanese and hence the name Japanese Candlestick chart has become very famous.
As a matter of fact, this method of charting captured the attention of Wall Street traders much later. Japanese were using this technique for tracking the price movement of agricultural commodities. For all the practical purposes when a technical analyst refers to Candlestick charts, it essentially implies Japanese Candlestick chart.
Construction of Candlestick charts (refer drawing)
Like bar chart, construction of candlestick charts is also very easy. Let us try to understand how it is done.
- Each candlestick line represents the activity for a fixed period that could be an hour or a day or a week or a month. It shows the prices at opening, high price, low price and closing price. OHLC is a frequently used acronym for open high low close.
- Main body or real body is either filled in (black or red) or hollow (white or green) and
- It represents the price range between the opening and closing prices. Black and white colors were used as per the traditional methods when the charts were drawn manually. However, in most of the latest computer aided charting red and green colors are used.
- If the opening price is higher than the closing price then the main body is filled.
- If the closing price is higher than the opening price then the main body is hollow.
- The thin lines above and below the main body are called as shadows or wick. Shadows represent the high and low prices for the particular period.
Comparison between a standard bar chart and a Japanese Candlestick chart
- Scaling is same.
- Overall shape is same.
- Both the charts can be used in conjunction to study other technical analysis tools such as moving averages, oscillators and other methods.
- Range of high and low is same for each period.
- Different types of patterns develop in both the charts that can help to identify the market trend.
- There is only one difference. How the opening and closing prices are displayed.
Advantages of Japanese Candlestick chart over the standard bar chart
- Visual analysis is much easier and hence the traders can read the price action much faster.
- Comprehension of market sentiments can be done in a better way.
- Many traders believe that the Japanese Candlestick charts provide a better depth of information over the traditional bar charts.
- Traders find it easy and quick to analyze the trend reversal, trend continuation and other patterns. Identifying the pattern is usually considered as one of the most difficult part of technical analysis.
Patterns of Japanese Candlestick chart
Candlesticks can take variety of shapes depending upon the relationship of OHLC. Shape of each Candlestick represents different interpretations such as extremely bullish, extremely bearish, bullish, bearish, neutral, turning period and end of the trend. Besides the shapes of individual Candlestick, various patterns develop on the Candlestick chart. Major patterns are Bullish Reversal, Bearish reversal and Continuation.


